5 Must-Know Market Moves: Bezos Cashes Out, Trump Sparks Trade Shock, and Dividend Giants Roar Back.


This week in markets: Jeff Bezos offloads $737 million in Amazon stock, Trump ignites global tension with sweeping new tariffs, and two overlooked dividend giants are quietly bouncing back. Plus, we dive into fintech face-offs, unstoppable tech cash machines, and what it all means for your portfolio.

- 2 Beaten-Down Dividend Giants You’ll Regret Not Buying — Down 40% and Still Paying Strong! Realty Income and Hormel Foods may be out of favor, but their rock-solid dividends and elite track records make them perfect forever holds for smart, patient investors.

- Jeff Bezos Cashes Out $737 Million in Amazon Stock — What Does He Know That You Don’t?
Bezos just sold millions in Amazon shares as part of a $5.4 billion plan—raising eyebrows as analysts boost price targets and investors brace for what’s next.
https://finance.yahoo.com/news/bezos-sells-millions-amazon-com-151410025.html
- These 5 Tech Giants Are Raking in Billions — And Practically Printing Money for Shareholders!
Apple, Microsoft, Alphabet, Meta, and more are turning record-breaking cash flows into stock buybacks and dividends — here’s why these tech powerhouses might be your smartest long-term investment.
https://www.nasdaq.com/articles/these-5-technology-stocks-are-money-printing-machines
- Robinhood Skyrockets While SoFi Stumbles — Which Fintech Titan Will Dominate Your Portfolio Next?
Robinhood’s explosive growth has outshined SoFi’s stumble despite both scaling fast, but which fintech stock holds the real long-term upside for investors?

- Trump Unleashes Tariff Tsunami on 14 Nations — See Who’s Getting Hit the Hardest Starting August 1!
President Trump just announced sweeping tariffs of up to 40% on imports from 14 countries, shaking global markets and setting the stage for a fiery trade showdown this summer.


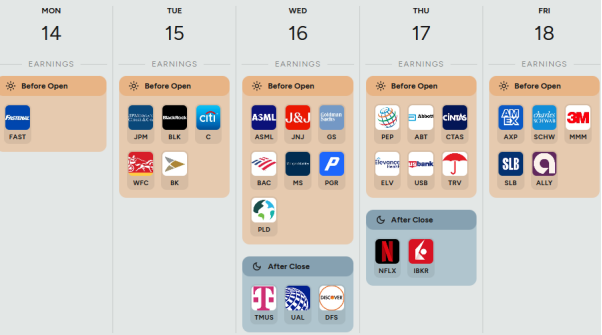
A heads-up on popular companies' earnings week from July 14 to July 18. Stay informed about when key financial updates are coming out.

Feeling overwhelmed by too many stock choices and market noise?
Instead of wasting time chasing tips or trying to make sense of market chatter, you’ll get straight-to-the-point insights on promising stocks, ETFs, and key trends — all in a clear, no-BS format you can use. No jargon. No fluff. Just curated ideas to help you invest smarter, faster, and with more confidence.
Stay ahead of the market, save hours of research, and grow your portfolio with clarity.
Check out here — and start making informed moves in minutes.

Sharpen Your Investing Skills: Why Every Investor Should Understand the RSI Indicator.
The Relative Strength Index (RSI) is a momentum indicator that measures whether a stock is overbought or oversold. It’s one of the easiest and most popular technical tools used by smart investors to avoid emotional buys and catch high-probability trades.
RSI ranges from 0 to 100.
- Above 70 = Overbought (price may drop)
- Below 30 = Oversold (price may bounce)
How Investors Use RSI
Avoid buying at the peak: If a stock looks hot but RSI is 80+, it may be due for a pullback.
Spot potential reversals: When RSI dips below 30 and starts climbing, it could signal a rebound.
Confirm trend strength: During a strong uptrend, RSI may hover between 40–70 — that’s healthy momentum.
Quick Tip
Never use RSI alone — combine it with volume, support/resistance levels, or candlestick patterns to boost accuracy.

From politics to profits, the markets are anything but quiet — and staying informed is your edge. Whether you're chasing growth, craving dividends, or sidestepping risk, now’s the time to sharpen your strategy and invest with conviction. The winners of tomorrow are being shaped today.
Disclaimer: This content is for informational purposes only and does not constitute investment advice. Please do your own due diligence before making any investment decisions.