The Prepared Win: This Week’s Key Market Signals


The stock market rewards the prepared—are you ready for what’s next?
This week, we’ll break down how corporate buybacks shape stock prices, key red flags that could save you from bad trades, and whether recent losers are about to bounce back.

- Trump’s Tariff U-Turn! Stocks Plunge as Trade War Heats Up Trump pauses tariffs on some Canadian and Mexican goods, but the stock market tanks as investors fear more economic turmoil ahead.

- STOCKS CRASH! Dow Plummets 900 Points as Recession Fears Explode! Wall Street suffers a brutal sell-off as Trump’s tariff policies shake investor confidence, sending the Nasdaq into its worst day since 2022!

- C3.ai SMASHES Expectations—But Wall Street Still Isn’t Buying It! Despite impressive revenue growth and a booming Microsoft partnership, C3.ai stock keeps plunging—why are analysts still skeptical?

- 3 Beaten-Down Stocks Ready for a MASSIVE Comeback This Week! After tumbling over 20% last week, Marvell, VF Corp., and Hims & Hers Health could be primed for a major rebound—here’s why savvy investors are watching closely!

- The Untold Story of Buffett & Munger’s Boldest Bet—And the Investing Secret It Reveals! Discover how Warren Buffett and Charlie Munger turned a risky bet on Blue Chip Stamps into a fortune—and the powerful lesson that could change the way you invest forever!


Sharpen Your Investing Skills: Understanding the Average True Range (ATR)
The Average True Range (ATR) is a volatility indicator that helps investors measure how much a stock typically moves over a given period. Unlike trend-following indicators, ATR does not predict price direction but instead shows the degree of price volatility.
Why is ATR Important?
- Measures Market Volatility – Helps traders understand how much a stock fluctuates.
- Sets Stop-Loss Levels – Higher ATR suggests wider stop-loss placement, while lower ATR suggests tighter stops.
- Confirms Breakouts – A rising ATR during a breakout indicates a strong move.
How to Read ATR?
- Higher ATR → Indicates high volatility (big price swings).
- Lower ATR → Indicates low volatility (smaller price movements).
- Increasing ATR → Signals stronger price momentum.
- Decreasing ATR → Suggests price consolidation.
ATR in Trading Strategies
- Trend Confirmation – If ATR rises during an uptrend, it confirms strong momentum.
- Stop-Loss Adjustment – Traders use ATR values to set stop-loss orders based on volatility.
- Breakout Validation – A sudden rise in ATR alongside a price breakout suggests a valid breakout.
Now, let’s look at how ATR behaves with stock price movements.
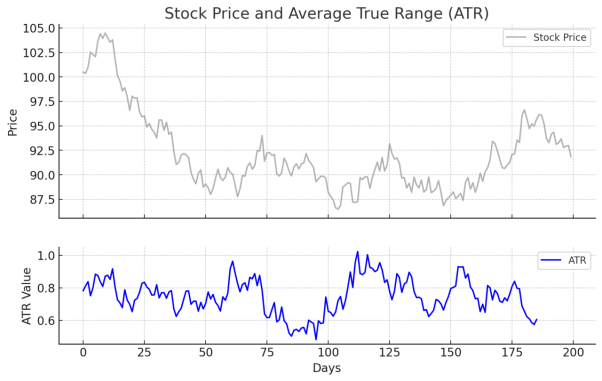
Here’s a chart showing how the Average True Range (ATR) moves with stock prices. The ATR Line (blue) indicates market volatility—higher values mean greater price swings, while lower values suggest calm market conditions. Traders use ATR to adjust stop-loss levels and confirm breakout strength.

The market is full of opportunities, but also risks. Staying aware of the signs, managing your emotions, and sticking to your strategy will help you make smarter decisions.
Remember, the key to success is knowing when to act—and when to stay patient.
Disclaimer: This content is for informational purposes only and does not constitute investment advice. Please do your due diligence before making any investment decisions.