The Weekly Market Pulse.

Volatility is back—and it’s moving fast.
The market is spiraling as tariffs loom, Tesla stumbles, and tech stocks take a beating. With uncertainty rising, now is the time to cut through the noise and focus on the facts.

- STOCK MARKET MELTDOWN! Tariffs, Tesla, and Tech Sell-Off Shake Wall Street. U.S. markets plunge as looming tariffs, Tesla's troubles, and a brutal tech sell-off send stocks spiraling—here’s what investors need to know before the chaos unfolds!
- TESLA IN TROUBLE? Stock Plunges as Trump Tariffs & Musk Controversy Shake Investor Confidence! Tesla shares tumble as analysts slash delivery estimates, Musk’s political ties spark backlash, and Trump’s tariffs threaten EV pricing—can Tesla bounce back?
https://finance.yahoo.com/news/tesla-stock-falls-amid-investor-concerns-over-trump-tariffs-elon-musks-government-ties-153304566.html
- 2 AI Stocks Set to Skyrocket 124% – Wall Street Says Buy NOW Before It's Too Late! Despite the recent AI stock sell-off, analysts predict massive upside for these two AI powerhouses—could this be the perfect buying opportunity?
https://finance.yahoo.com/news/2-artificial-intelligence-ai-stocks-120000704.html
- 3 U.S. Stocks Trading Nearly 50% Below Fair Value – Hidden Gems Ready to Soar! Wall Street may be sleeping on these deeply undervalued stocks—could this be your chance to grab massive gains before the market catches on?
https://finance.yahoo.com/news/3-us-stocks-estimated-48-100217470.html
- Markets on Edge: Tech Rallies, Canada Hits Back, and U.S. Deficit Soars Past $1 Trillion! From a booming Nasdaq to a trade war heating up and a record-breaking budget deficit—here’s what you NEED to know before the market opens!


Sharpen Your Investing Skills: Understanding the Parabolic SAR (Stop and Reverse)
The Parabolic SAR (Stop and Reverse) is a trend-following indicator that helps traders identify potential reversal points in price movement. It is represented by a series of dots placed above or below the price chart.
Why is Parabolic SAR Important?
- Identifies Trend Direction – Helps traders follow uptrends and downtrends
- Generates Entry & Exit Signals – A dot flipping from below to above price suggests a reversal.
- Helps with Stop-Loss Placement – The dots act as trailing stop-loss levels.
How to Read Parabolic SAR?
- Dots Below Price → Uptrend (buy signal).
- Dots Above Price → Downtrend (sell signal).
- Dots Flip Position → Possible trend reversal.
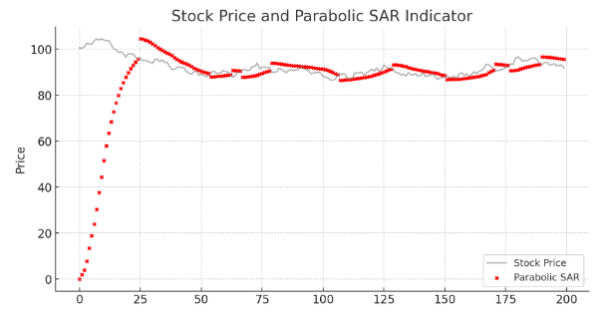
Here’s a chart showing how the Parabolic SAR indicator moves with stock prices. The red dots represent the SAR values. When the dots appear below the price, it signals an uptrend (buy opportunity). When they move above the price, it suggests a downtrend (sell opportunity).

The stock market is always shifting—but behind every move is a pattern, a signal, or an opportunity. The key is staying informed, disciplined, and focused on the bigger picture. Whether you're riding a breakout or waiting out a pullback, remember: long-term success comes from preparation, not prediction.
Stay sharp, stay patient, and let your strategy guide you.
Disclaimer: This content is for informational purposes only and does not constitute investment advice. Please do your due diligence before making any investment decisions.