This Week in the Market: Hidden Buyback Moves, Stock Traps & How to Handle the Chaos.


The stock market never stops moving, and neither should your strategy. This week, we break down the hidden power of corporate buybacks, warning signs to watch for, and beaten-down stocks, are they opportunities or traps?
If volatility keeps you up at night, it’s time to rethink your game plan. Let’s dive in.

- AI Stock Sell-Off! Nvidia & Marvell Crash as Investors Panic—Is the AI Boom Over? Nvidia, Marvell, and other AI chip stocks are tanking as trade fears, rising competition, and disappointing earnings shake investor confidence—here’s what it means for the future of AI investing.

- 10 Stock Market Red Flags Every Investor Must Know—Are You Ignoring These Warning Signs? From fraudulent financials to missed earnings guidance, these 10 red flags could spell disaster for your portfolio—spot them before it’s too late!
https://www.nasdaq.com/articles/im-a-financial-analyst:-10-red-flags-i-look-for-before-investing-in-a-stock
- SAP’s Game-Changer: The Business Data Cloud That’s Supercharging AI! SAP is revolutionizing AI with its Business Data Cloud, using zero-copy sharing and cutting-edge data management to unlock next-level AI performance—here’s how it works!

- These 13 Beaten-Down Stocks Are Set to Skyrocket—Here’s Why! Despite steep declines, analysts predict these high-growth stocks could surge at least 29% in the next 12 months—check out which ones made the list!
https://www.morningstar.com/news/marketwatch/2025031062/these-13-growth-stocks-have-dropped-this-year-they-are-expected-to-roar-back
- New to Investing? Here’s How to Get Started the Right Way! Before diving into stocks, learn how to assess your finances, budget smartly, and build a solid foundation for long-term investing success!


Sharpen Your Investing Skills: Understanding the Relative Strength Index (RSI)
The Relative Strength Index (RSI) is a popular momentum indicator that helps investors determine whether a stock is overbought or oversold. It measures the speed and magnitude of recent price changes on a scale of 0 to 100.
Why is RSI Important?
- Identifies Overbought & Oversold Conditions – Helps investors spot potential reversals.
- Confirms Trend Strength – A strong RSI supports the current trend.
- Detects Divergence – When RSI moves opposite to the stock price, it may signal a trend reversal.
How to Read RSI?
- Above 70 – The stock may be overbought (potential sell signal).
- Below 30 – The stock may be oversold (potential buy signal).
- Between 30-70 – The stock is in a neutral zone.
RSI in Action
Now, let's look at a chart showing how RSI behaves with stock price movements.
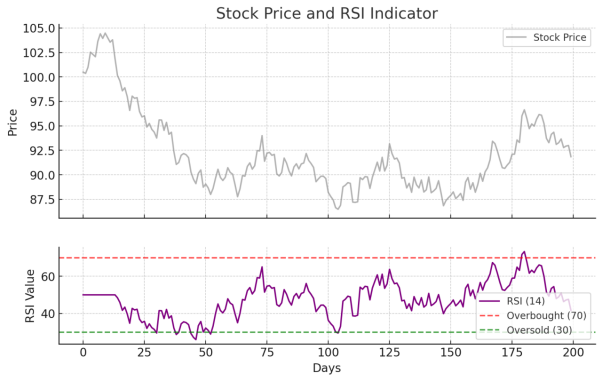
Here’s a chart showing how RSI behaves alongside stock price movements. When RSI crosses above 70, the stock may be overbought (red dashed line), and when it drops below 30, it may be oversold (green dashed line). Investors use RSI to identify potential buy and sell opportunities.

That’s all for this week. The market is full of opportunities, but also risks. Staying aware of the signs, managing your emotions, and sticking to your strategy will help you make smarter decisions.
Remember, the key to success is knowing when to act—and when to stay patient.
Happy investing, and stay sharp!
Disclaimer: This content is for informational purposes only and does not constitute investment advice. Please do your due diligence before making any investment decisions.